The overview
The total findings and the assets they touch, with a short summary of the threats, the vulnerabilities and the controls. Then the themes and control domains, each with the number of assets affected.


Thematic analysis, risk and threat modelling
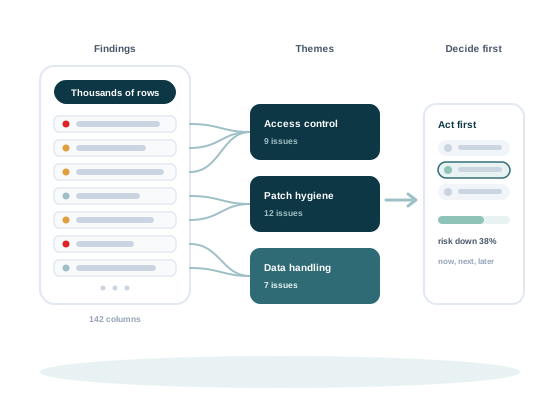
Ivy Farsight reads the security findings your company already has, from audits, scanners and reviews. It groups them by the problem behind them, shows where the risk sits, and plans the actions that lower it most. It runs on your own machine.
For security leaders, risk and compliance teams, and the engineers who fix what the findings show.
How it works
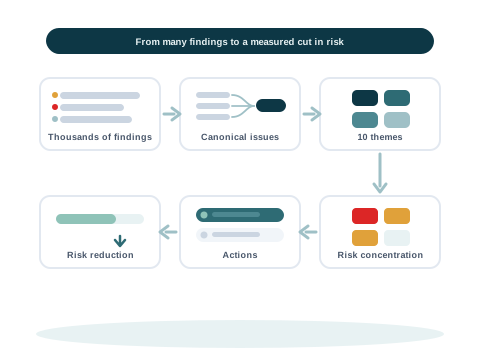
A findings dataset (A table of the security findings a company already has, from audits, scanners and reviews, with one finding on each row. Usually an Excel workbook or a CSV file.) goes in. Themes, a risk view, a plan for three kinds of reader and threat models come out. Fixed rules set every number, so the same data and settings always give the same result.
Your Excel, CSV (Comma separated values. A plain text table, one row per line, that any spreadsheet can open.), TSV (Tab separated values. A plain text table with a tab between the columns.), JSON (A plain text file format for data.) or BSON (Binary JSON. The file format MongoDB exports its records in.) export. Ivy Farsight suggests a column mapping (Which column of your file holds which field Ivy Farsight reads. It suggests a match for each column, with its reason, and a person approves it.), and a person approves it. Each finding keeps its row in your file.
Findings with one cause become one canonical issue (One underlying problem that many findings describe. Findings that agree on their control, threat path, text, assets and timing are grouped into one canonical issue.). Issues roll up into risk themes (A group of canonical issues that management can steer as one topic, such as vulnerability management or access control.) for management.
Inherent risk (The risk before any control is counted: how likely it is, multiplied by how much harm it would do.), residual risk (The part of a risk that is left once the controls in place are counted.) and a priority, each with its formula and its inputs.
Control options, an order of actions, and the risk left after each one.
The total findings and the assets they touch, with a short summary of the threats, the vulnerabilities and the controls. Then the themes and control domains, each with the number of assets affected.
An executive view of the whole picture, and an asset owner view of one owner's assets, findings and remediation priorities.
Open a theme or a domain, filter to an asset, and inspect one finding. Each level says what needs to be done, and you can ask how to mitigate a finding.
An Explain button on each figure shows how it was worked out, with the likelihood and the impact behind a risk. A confidence score shows how sure the analysis is.
Thousands of findings often come down to a few problems. Ivy Farsight finds them, and shows its working.
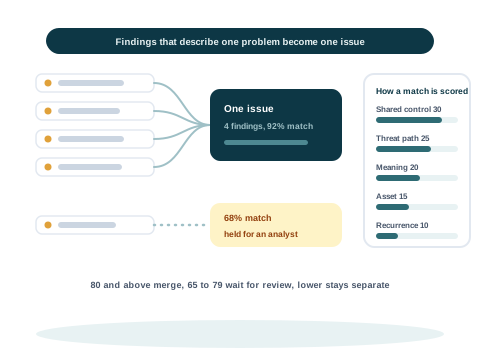
Many findings share one weak control. Counted one by one, the cause stays hidden. Ivy Farsight compares findings on five parts, and groups the ones that agree.
Each member of an issue shows its score, the points of each part, and the reason in words.
The score, with weights you can set
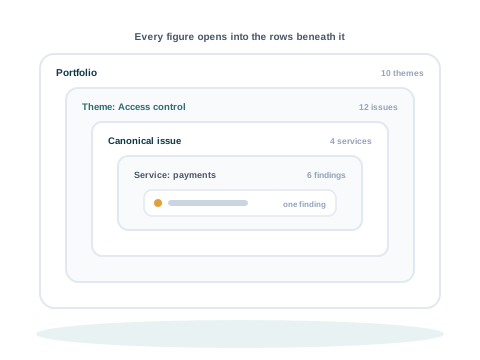
Issues roll up into themes that management can steer, such as access control or patch hygiene. Themes form from a shared control weakness, a shared threat path and where the assets concentrate. Each theme says why its issues belong together.
Every level opens to the one below it: theme, issue, service, finding, and the original row of your file.
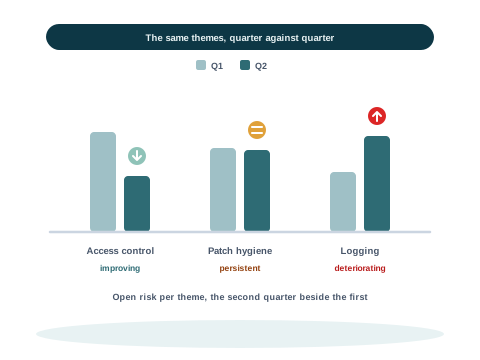
Each theme compared with the quarter before: improving, persistent or deteriorating.
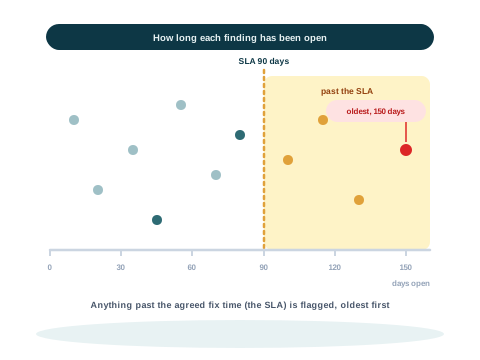
Findings by days open, with the ones past their SLA (Service level agreement. The number of days a finding of its severity may stay open. After that it is overdue.) flagged, oldest first.
Every score has a formula and its inputs. Rules draft the options and the plan. People decide.
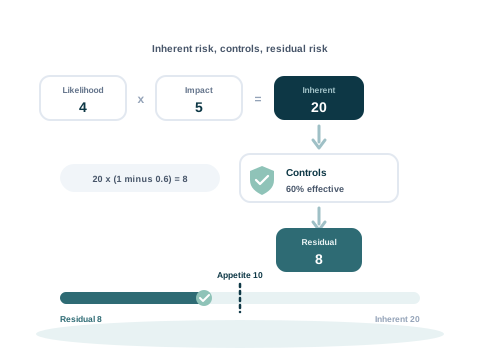
Inherent risk is likelihood multiplied by impact. Residual risk is the inherent risk multiplied by one minus the control effectiveness (How much of a risk the controls in place remove, as a share from 0 to 100 per cent.).
The priority then adds the context: how critical the asset is, how exposed, how easy to exploit, and whether the problem keeps coming back. For any issue, "How is this calculated?" shows each input, so you can work the score out again.
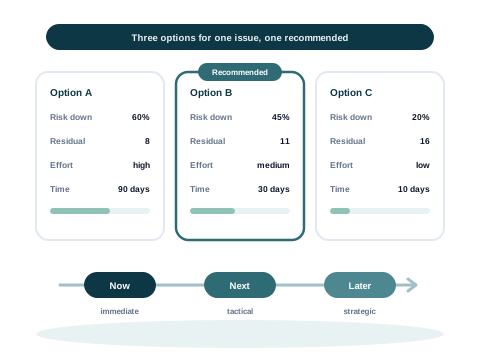
For each issue there are two or three control options. Each shows the risk it removes, the risk it leaves, the effort, the days, and what may block it. Each names the issues and findings it covers.
A recommended path follows: a quick win, a strategic fix and a compensating control, with the risk left after each.
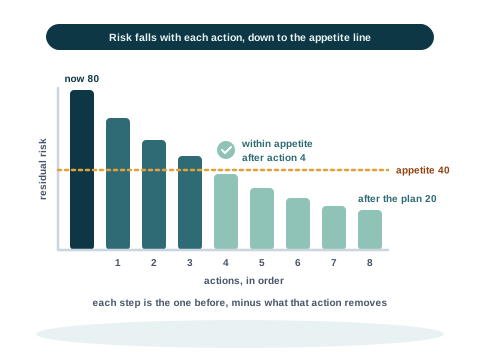
The plan applies the actions in order and works out the risk again after each one. A chart shows the risk falling, your risk appetite (The amount of risk a company decides it is willing to accept.) line, and the action that brings the risk within it.
Each step equals the step before, minus what that action removes. So the chart and the numbers always agree.
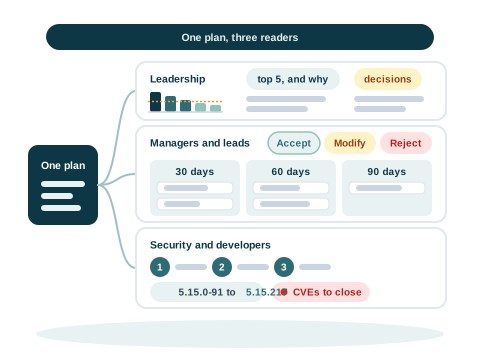
The remediation plan is one set of figures. Each reader gets the view they need, so management and the engineers talk about the same numbers.
Every step names the issues and findings it addresses, and the rule it came from.
The risk now and after the plan, the top five issues and why, and the decisions to make.
Work for each owner on a 30, 60 and 90 day board, and the recommended path to accept, modify or reject.
Numbered steps with commands and checks, the host, the IP address and the version to reach, and the CVEs (Common Vulnerabilities and Exposures. The public identifier for one known vulnerability in one product.) each step closes.
The steps come from 1,162 remediation rules written by Visiminds, each with references to NIST SP 800-53 Rev. 5, ISO/IEC 27001:2022 Annex A and CIS Critical Security Controls v8 safeguards. The effectiveness of each step is a planning assumption until a person validates the fix.
The vulnerability data covers 18 products today, and it is updated only when a person chooses.
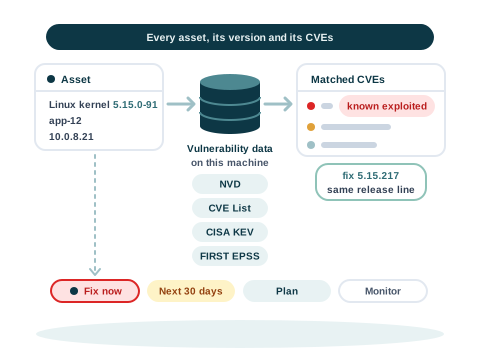
Each asset's product and version are matched to the CVEs that affect it. The vulnerability data is kept on your machine: version ranges from the NVD (National Vulnerability Database. The public database of CVEs kept in the United States, with the product versions each one affects.), the CVE List, CISA's (Cybersecurity and Infrastructure Security Agency. The cybersecurity agency of the United States. It publishes the list of known exploited vulnerabilities.) Known Exploited Vulnerabilities (Known Exploited Vulnerabilities. CISA's list of vulnerabilities that attackers are known to have used.) catalogue and FIRST's (Forum of Incident Response and Security Teams. A global forum of security response teams. It publishes the EPSS scores.) EPSS (Exploit Prediction Scoring System. A daily score for how likely a vulnerability is to be exploited in the next 30 days.) scores.
Each asset falls into one of four groups, Fix now, Next 30 days, Plan or Monitor, with the reasons. An asset with a known exploited CVE is never below the second group.
A threat model (A list of what could go wrong in a system: its parts, the boundaries between them, and the threats against each, with how serious each one is.) of the estate drawn from the findings, and one of a running application drawn from its files.
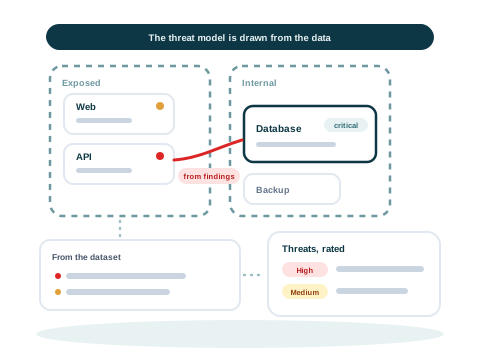
Ivy Farsight draws the zones, the services in them and the trust boundaries (Where data passes from something you do not control into something you do.) between them, with a rated register of threats. Each threat has its STRIDE (Spoofing, tampering, repudiation, information disclosure, denial of service and elevation of privilege. The six kinds of threat used in threat modelling.) category and the findings behind it.
A path is drawn only where findings show it. Anything inferred is labelled as inferred.
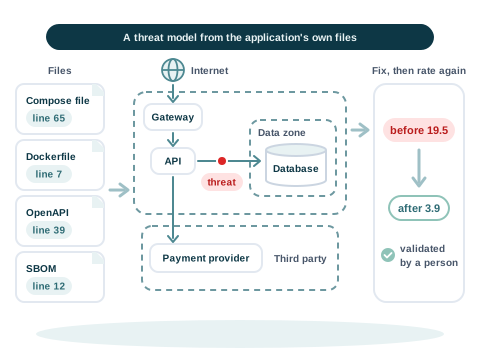
Ivy Farsight reads an application's deployment files: its container setup, its OpenAPI (A file that describes an API: its routes, its inputs, and how callers sign in.) description and its software bill of materials (Software bill of materials. The list of every part your software is made of, with versions.). Every fact keeps its file and line. It drafts a DFD (Data flow diagram. A drawing of the parts of a system and the data that moves between them, with the trust boundaries the data crosses.) with the trust boundaries, and threats against named parts and flows.
A person confirms, edits or rejects each part. For each high threat there are two or three options, and a ticket a developer can act on. After a fix, the threat is rated again once a person validates the fix.
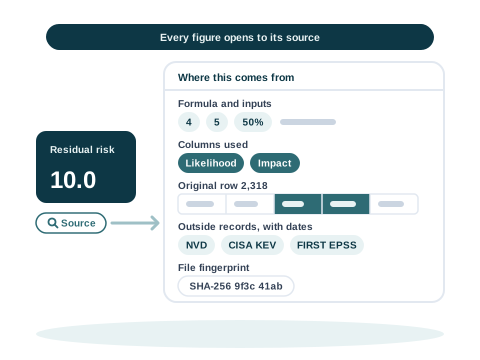
Each score, theme, issue, asset, CVE and threat carries a Source button. It shows what the figure is, its formula and inputs, the columns and rows used, and the original row of your file with the cells it used marked.
Outside records show their dates. The file keeps its SHA-256 (A code worked out from every byte of a file, used as its fingerprint. Any change to the file gives a different code.) fingerprint, so you can prove which file an analysis read. This is the figure's provenance (Where a figure comes from: the file and its row, the columns and formula used, the outside records, and the person who decided.).
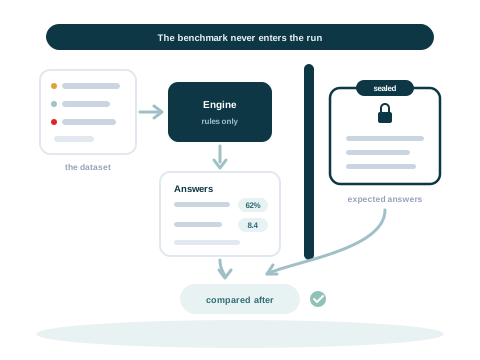
Visiminds checked Ivy Farsight on an anonymised reference sample that came with expected answers. The expected answers are never inputs: they are kept apart during the run and compared only afterwards.
Measured on 2 October 2026: Ivy Farsight found all 12 canonical issues and all 10 themes of the expected answers, in 100% agreement.
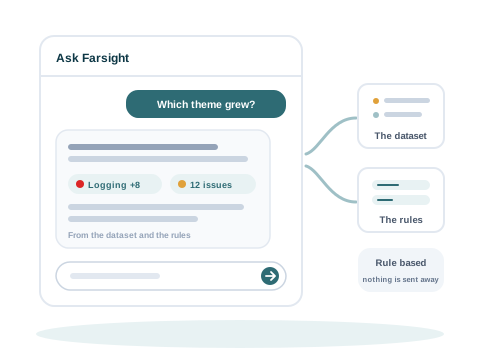
Ask questions in plain words: why these findings were grouped, what drives a score, what to fix first. The answers come from the analysis and from fixed rules. This is rule-based AI (AI built from fixed rules that can be read, not from a trained machine learning model. The same data and the same question always give the same answer.): the same question always gets the same answer, and a question it cannot answer is declined.
It understands the ids of findings, issues and themes, hostnames, IP address ranges, CVEs, versions, conditions such as "residual above 15", and requests to group or rank.
For exports of the same kind, again and again: Excel, CSV, TSV, JSON or BSON, with no size limit by default.
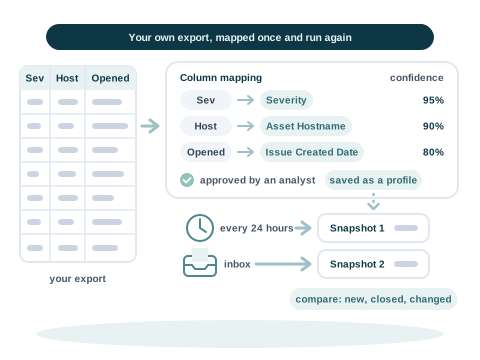
Ivy Farsight finds the header row and the sheet, also in untidy files. It suggests which column holds which field, with a confidence and a reason, and saves the approved mapping as a profile for the next export.
Before a run it shows what it will tidy, such as dates and severities, and it keeps every original value.
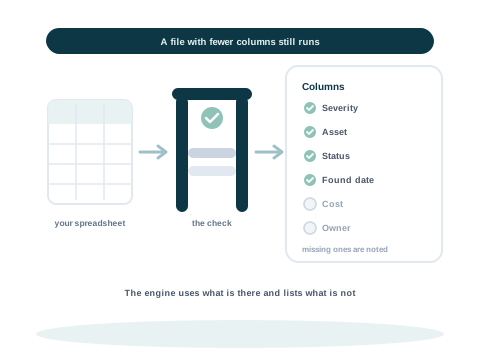
The full schema has 142 columns, and only 4 are required: an id, a status, a severity and a title. Ivy Farsight uses what is there.
Each part of the analysis names the columns it lacked, so a gap is never mistaken for a clean result.
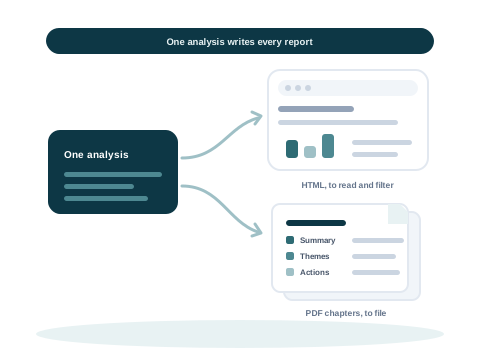
Every analysis writes an HTML report to read and filter, and a PDF report to file. Both come from the same content, so they agree.
Ticket files for Jira, ServiceNow, Azure DevOps and CSV, and a risk register for an IRM (Integrated risk management. The tool where an organisation keeps its risk register.) tool. Your team imports them. Ivy Farsight sends nothing to them by itself.
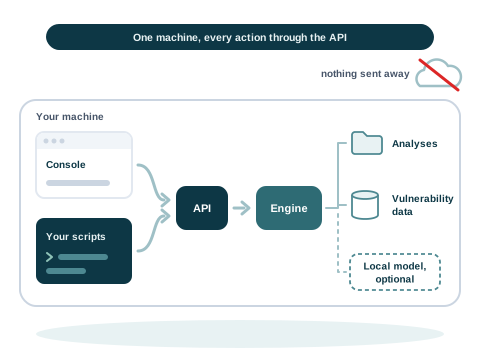
Ivy Farsight runs on your own machine, with no internet connection. The analyses, the vulnerability data and the optional language model stay on it.
Everything the console does is a call to its API (Application programming interface. The interface one program uses to talk to another.), with a published description and a guide. Your team can script the same steps.
Write to info@visiminds.com. We can show it on a sample dataset, or on an export of your own findings, on your own machine.